Home
/
Blog
/
Tech Tutorials
/
Practical Guide to Logistic Regression Analysis in R

Practical Guide to Logistic Regression Analysis in R

Author
Manish Saraswat
Calendar Icon
January 5, 2017
Timer Icon
9 min read
Share

Introduction

Recruiters in the analytics/data science industry expect you to know at least two algorithms: Linear Regression and Logistic Regression. I believe you should have in-depth understanding of these algorithms. Let me tell you why.

Due to their ease of interpretation, consultancy firms use these algorithms extensively. Startups are also catching up fast. As a result, in an analytics interview, most of the questions come from linear and Logistic Regression.

In this article, you'll learn Logistic Regression in detail. Believe me, Logistic Regression isn't easy to master. It does follow some assumptions like Linear Regression. But its method of calculating model fit and evaluation metrics is entirely different from Linear/Multiple regression.

But, don't worry! After you finish this tutorial, you'll become confident enough to explain Logistic Regression to your friends and even colleagues. Alongside theory, you'll also learn to implement Logistic Regression on a data set. I'll use R Language. In addition, we'll also look at various types of Logistic Regression methods.

Note: You should know basic algebra (elementary level). Also, if you are new to regression, I suggest you read how Linear Regression works first.

Table of Contents

  1. What is Logistic Regression ?
  2. What are the types of Logistic Regression techniques ?
  3. How does Logistic Regression work ?
  4. How can you evaluate Logistic Regression's model fit and accuracy ?
  5. Practical - Who survived on the Titanic ?
Machine learning challenge, ML challenge

What is Logistic Regression ?

Many a time, situations arise where the dependent variable isn't normally distributed; i.e., the assumption of normality is violated. For example, think of a problem when the dependent variable is binary (Male/Female). Will you still use Multiple Regression? Of course not! Why? We'll look at it below.

Let's take a peek into the history of data analysis.

So, until 1972, people didn't know how to analyze data which has a non-normal error distribution in the dependent variable. Then, in 1972, came a breakthrough by John Nelder and Robert Wedderburn in the form of Generalized Linear Models. I'm sure you would be familiar with the term. Now, let's understand it in detail.

Generalized Linear Models are an extension of the linear model framework, which includes dependent variables which are non-normal also. In general, they possess three characteristics:

  1. These models comprise a linear combination of input features.
  2. The mean of the response variable is related to the linear combination of input features via a link function.
  3. The response variable is considered to have an underlying probability distribution belonging to the family of exponential distributions such as binomial distribution, Poisson distribution, or Gaussian distribution. Practically, binomial distribution is used when the response variable is binary. Poisson distribution is used when the response variable represents count. And, Gaussian distribution is used when the response variable is continuous.

Logistic Regression belongs to the family of generalized linear models. It is a binary classification algorithm used when the response variable is dichotomous (1 or 0). Inherently, it returns the set of probabilities of target class. But, we can also obtain response labels using a probability threshold value. Following are the assumptions made by Logistic Regression:

  1. The response variable must follow a binomial distribution.
  2. Logistic Regression assumes a linear relationship between the independent variables and the link function (logit).
  3. The dependent variable should have mutually exclusive and exhaustive categories.

In R, we use glm() function to apply Logistic Regression. In Python, we use sklearn.linear_model function to import and use Logistic Regression.

Note: We don't use Linear Regression for binary classification because its linear function results in probabilities outside [0,1] interval, thereby making them invalid predictions.

What are the types of Logistic Regression techniques ?

Logistic Regression isn't just limited to solving binary classification problems. To solve problems that have multiple classes, we can use extensions of Logistic Regression, which includes Multinomial Logistic Regression and Ordinal Logistic Regression. Let's get their basic idea:

1. Multinomial Logistic Regression: Let's say our target variable has K = 4 classes. This technique handles the multi-class problem by fitting K-1 independent binary logistic classifier model. For doing this, it randomly chooses one target class as the reference class and fits K-1 regression models that compare each of the remaining classes to the reference class.

Due to its restrictive nature, it isn't used widely because it does not scale very well in the presence of a large number of target classes. In addition, since it builds K - 1 models, we would require a much larger data set to achieve reasonable accuracy.

2. Ordinal Logistic Regression: This technique is used when the target variable is ordinal in nature. Let's say, we want to predict years of work experience (1,2,3,4,5, etc). So, there exists an order in the value, i.e., 5>4>3>2>1. Unlike a multinomial model, when we train K -1 models, Ordinal Logistic Regression builds a single model with multiple threshold values.

If we have K classes, the model will require K -1 threshold or cutoff points. Also, it makes an imperative assumption of proportional odds. The assumption says that on a logit (S shape) scale, all of the thresholds lie on a straight line.

Note: Logistic Regression is not a great choice to solve multi-class problems. But, it's good to be aware of its types. In this tutorial we'll focus on Logistic Regression for binary classification task.

How does Logistic Regression work?

Now comes the interesting part!

As we know, Logistic Regression assumes that the dependent (or response) variable follows a binomial distribution. Now, you may wonder, what is binomial distribution? Binomial distribution can be identified by the following characteristics:

  1. There must be a fixed number of trials denoted by n, i.e. in the data set, there must be a fixed number of rows.
  2. Each trial can have only two outcomes; i.e., the response variable can have only two unique categories.
  3. The outcome of each trial must be independent of each other; i.e., the unique levels of the response variable must be independent of each other.
  4. The probability of success (p) and failure (q) should be the same for each trial.
Let's understand how Logistic Regression works. For Linear Regression, where the output is a linear combination of input feature(s), we write the equation as:

Y = ?o + ?1X + ?

In Logistic Regression, we use the same equation but with some modifications made to Y. Let's reiterate a fact about Logistic Regression: we calculate probabilities. And, probabilities always lie between 0 and 1. In other words, we can say:

  1. The response value must be positive.
  2. It should be lower than 1.

First, we'll meet the above two criteria. We know the exponential of any value is always a positive number. And, any number divided by number + 1 will always be lower than 1. Let's implement these two findings:

This is the logistic function.

Now we are convinced that the probability value will always lie between 0 and 1. To determine the link function, follow the algebraic calculations carefully. P(Y=1|X) can be read as "probability that Y =1 given some value for x." Y can take only two values, 1 or 0. For ease of calculation, let's rewrite P(Y=1|X) as p(X).

logistic regression equation derivation

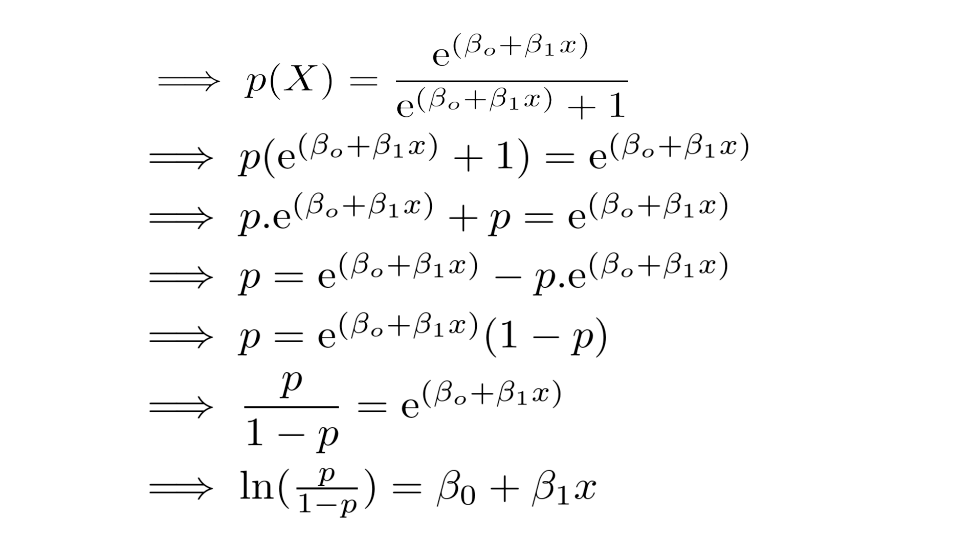
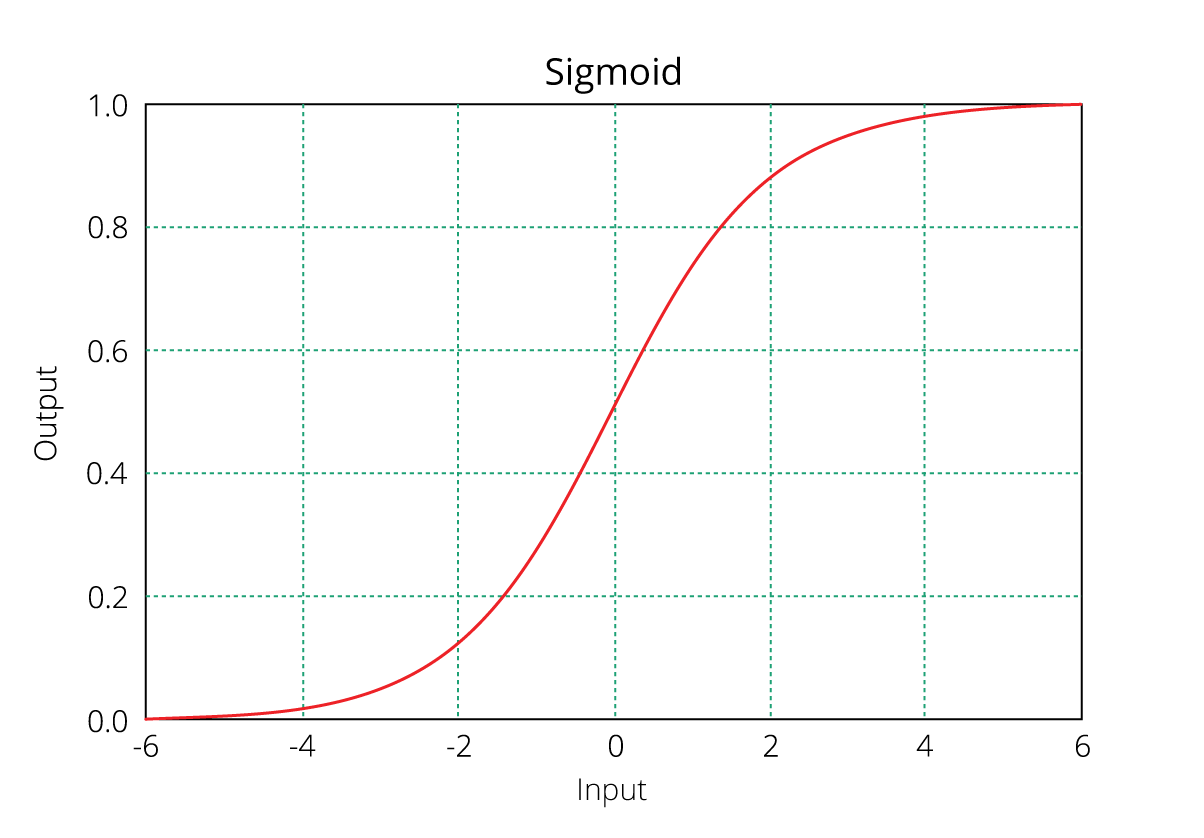
As you might recognize, the right side of the (immediate) equation above depicts the linear combination of independent variables. The left side is known as the log - odds or odds ratio or logit function and is the link function for Logistic Regression. This link function follows a sigmoid (shown below) function which limits its range of probabilities between 0 and 1.

SigmoidPlot logistic function

Until here, I hope you've understood how we derive the equation of Logistic Regression. But how is it interpreted?

We can interpret the above equation as, a unit increase in variable x results in multiplying the odds ratio by ? to power ?. In other words, the regression coefficients explain the change in log(odds) in the response for a unit change in predictor. However, since the relationship between p(X) and X is not straight line, a unit change in input feature doesn't really affect the model output directly but it affects the odds ratio.

This is contradictory to Linear Regression where, regardless of the value of input feature, the regression coefficient always represents a fixed increase/decrease in the model output per unit increase in the input feature.

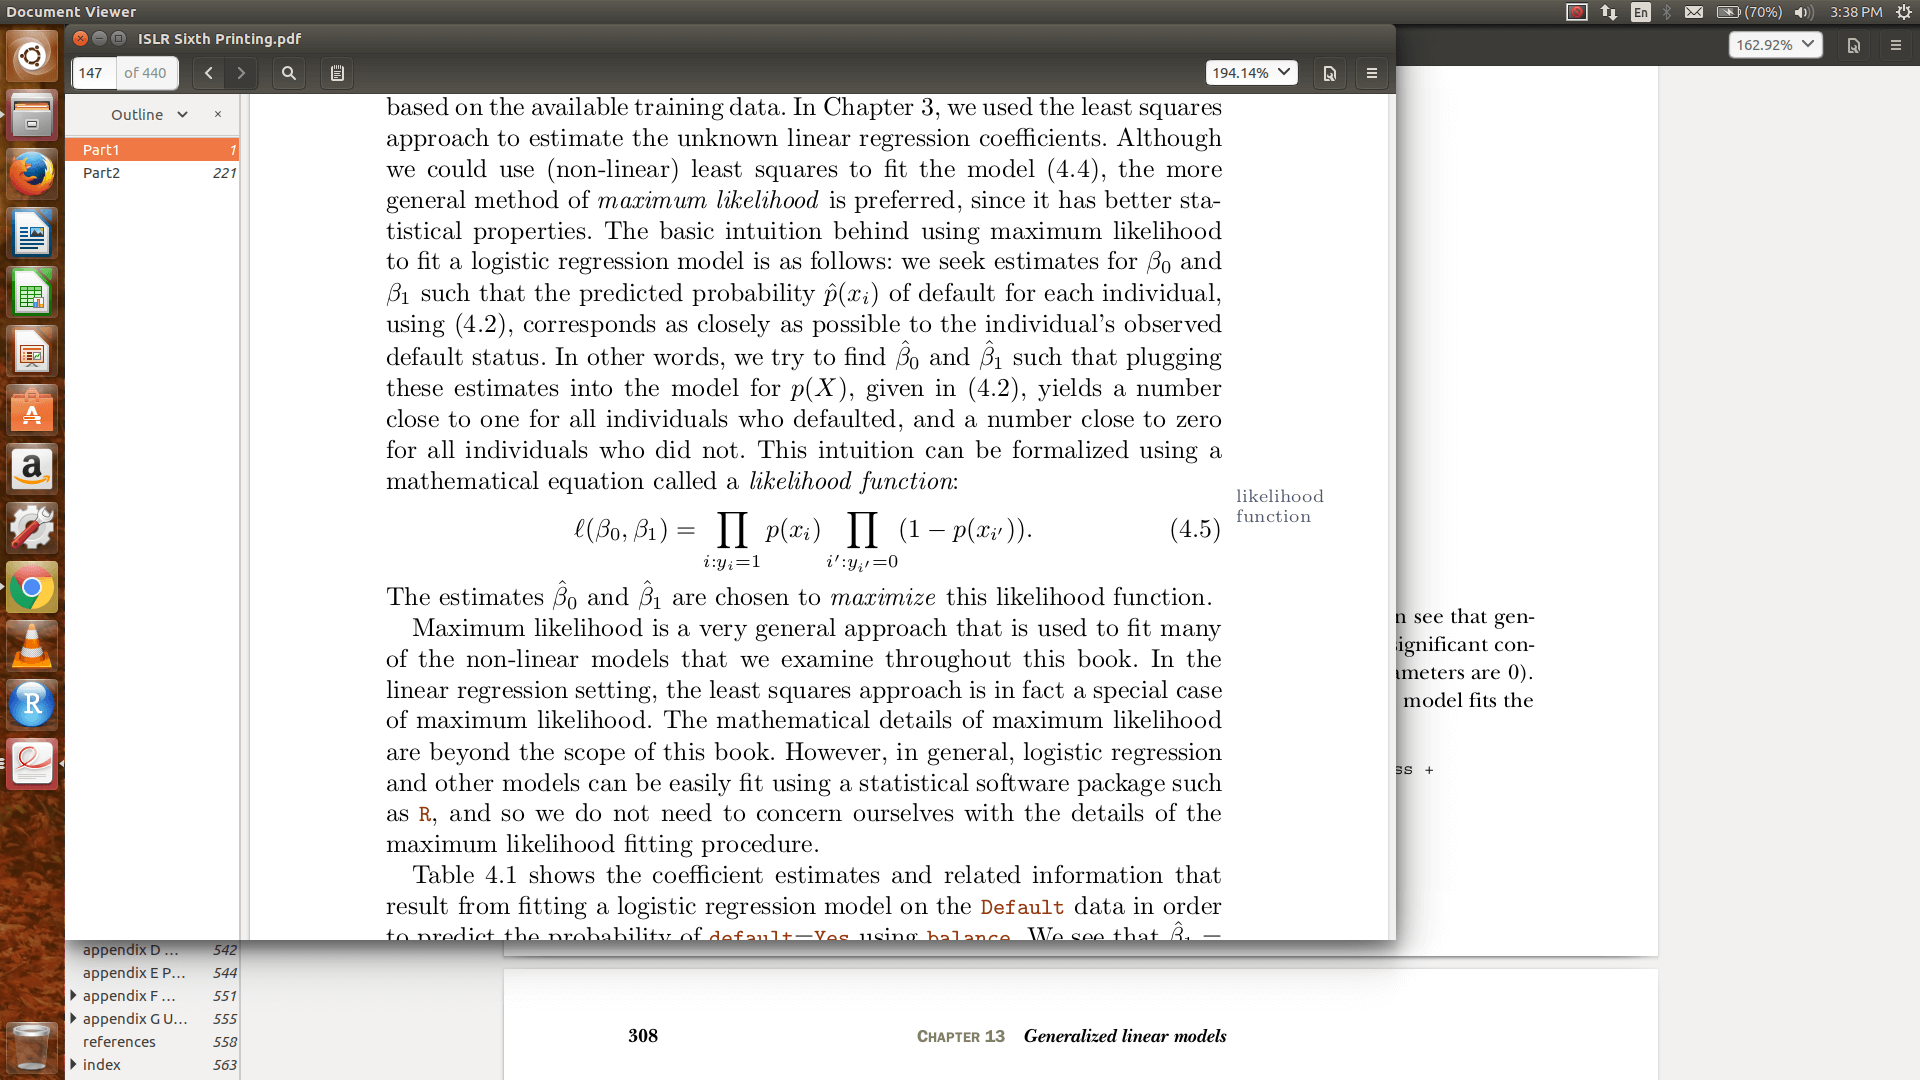
In Multiple Regression, we use the Ordinary Least Square (OLS) method to determine the best coefficients to attain good model fit. In Logistic Regression, we use maximum likelihood method to determine the best coefficients and eventually a good model fit.

Maximum likelihood works like this: It tries to find the value of coefficients (?o,?1) such that the predicted probabilities are as close to the observed probabilities as possible. In other words, for a binary classification (1/0), maximum likelihood will try to find values of ?o and ?1 such that the resultant probabilities are closest to either 1 or 0. The likelihood function is written as

How can you evaluate Logistic Regression model fit and accuracy ?

In Linear Regression, we check adjusted R², F Statistics, MAE, and RMSE to evaluate model fit and accuracy. But, Logistic Regression employs all different sets of metrics. Here, we deal with probabilities and categorical values. Following are the evaluation metrics used for Logistic Regression:

1. Akaike Information Criteria (AIC)

You can look at AIC as counterpart of adjusted r square in multiple regression. It's an important indicator of model fit. It follows the rule: Smaller the better. AIC penalizes increasing number of coefficients in the model. In other words, adding more variables to the model wouldn't let AIC increase. It helps to avoid overfitting.

Looking at the AIC metric of one model wouldn't really help. It is more useful in comparing models (model selection). So, build 2 or 3 Logistic Regression models and compare their AIC. The model with the lowest AIC will be relatively better.

2. Null Deviance and Residual Deviance

Deviance of an observation is computed as -2 times log likelihood of that observation. The importance of deviance can be further understood using its types: Null and Residual Deviance. Null deviance is calculated from the model with no features, i.e.,only intercept. The null model predicts class via a constant probability.

Residual deviance is calculated from the model having all the features.On comarison with Linear Regression, think of residual deviance as residual sum of square (RSS) and null deviance as total sum of squares (TSS). The larger the difference between null and residual deviance, better the model.

Also, you can use these metrics to compared multiple models: whichever model has a lower null deviance, means that the model explains deviance pretty well, and is a better model. Also, lower the residual deviance, better the model. Practically, AIC is always given preference above deviance to evaluate model fit.

3. Confusion Matrix

Confusion matrix is the most crucial metric commonly used to evaluate classification models. It's quite confusing but make sure you understand it by heart. If you still don't understand anything, ask me in comments. The skeleton of a confusion matrix looks like this:

confusion matrix logistic regression

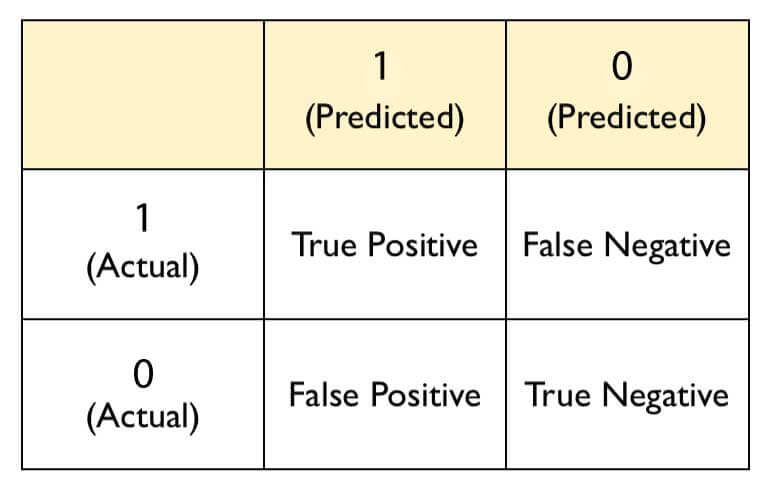
As you can see, the confusion matrix avoids "confusion" by measuring the actual and predicted values in a tabular format. In table above, Positive class = 1 and Negative class = 0. Following are the metrics we can derive from a confusion matrix:

Accuracy - It determines the overall predicted accuracy of the model. It is calculated as Accuracy = (True Positives + True Negatives)/(True Positives + True Negatives + False Positives + False Negatives)

True Positive Rate (TPR) - It indicates how many positive values, out of all the positive values, have been correctly predicted. The formula to calculate the true positive rate is (TP/TP + FN). Also, TPR = 1 - False Negative Rate. It is also known as Sensitivity or Recall.

False Positive Rate (FPR) - It indicates how many negative values, out of all the negative values, have been incorrectly predicted. The formula to calculate the false positive rate is (FP/FP + TN). Also, FPR = 1 - True Negative Rate.

True Negative Rate (TNR) - It indicates how many negative values, out of all the negative values, have been correctly predicted. The formula to calculate the true negative rate is (TN/TN + FP). It is also known as Specificity.

False Negative Rate (FNR) - It indicates how many positive values, out of all the positive values, have been incorrectly predicted. The formula to calculate false negative rate is (FN/FN + TP).

Precision: It indicates how many values, out of all the predicted positive values, are actually positive. It is formulated as:(TP / TP + FP).

F Score: F score is the harmonic mean of precision and recall. It lies between 0 and 1. Higher the value, better the model. It is formulated as 2((precision*recall) / (precision+recall)).

Subscribe to The HackerEarth Blog

Get expert tips, hacks, and how-tos from the world of tech recruiting to stay on top of your hiring!

Author
Manish Saraswat
Calendar Icon
January 5, 2017
Timer Icon
9 min read
Share

Hire top tech talent with our recruitment platform

Access Free Demo
Related reads

Discover more articles

Gain insights to optimize your developer recruitment process.

Vibe Coding: Shaping the Future of Software

A New Era of CodeVibe coding is a new method of using natural language prompts and AI tools to generate code. I have seen firsthand that this change makes software more accessible to everyone. In the past, being able to produce functional code was a strong advantage for developers. Today,...

A New Era of Code

Vibe coding is a new method of using natural language prompts and AI tools to generate code. I have seen firsthand that this change makes software more accessible to everyone. In the past, being able to produce functional code was a strong advantage for developers. Today, when code is produced quickly through AI, the true value lies in designing, refining, and optimizing systems. Our role now goes beyond writing code; we must also ensure that our systems remain efficient and reliable.

From Machine Language to Natural Language

I recall the early days when every line of code was written manually. We progressed from machine language to high-level programming, and now we are beginning to interact with our tools using natural language. This development does not only increase speed but also changes how we approach problem solving. Product managers can now create working demos in hours instead of weeks, and founders have a clearer way of pitching their ideas with functional prototypes. It is important for us to rethink our role as developers and focus on architecture and system design rather than simply on typing code.

The Promise and the Pitfalls

I have experienced both sides of vibe coding. In cases where the goal was to build a quick prototype or a simple internal tool, AI-generated code provided impressive results. Teams have been able to test new ideas and validate concepts much faster. However, when it comes to more complex systems that require careful planning and attention to detail, the output from AI can be problematic. I have seen situations where AI produces large volumes of code that become difficult to manage without significant human intervention.

AI-powered coding tools like GitHub Copilot and AWS’s Q Developer have demonstrated significant productivity gains. For instance, at the National Australia Bank, it’s reported that half of the production code is generated by Q Developer, allowing developers to focus on higher-level problem-solving . Similarly, platforms like Lovable enable non-coders to build viable tech businesses using natural language prompts, contributing to a shift where AI-generated code reduces the need for large engineering teams. However, there are challenges. AI-generated code can sometimes be verbose or lack the architectural discipline required for complex systems. While AI can rapidly produce prototypes or simple utilities, building large-scale systems still necessitates experienced engineers to refine and optimize the code.​

The Economic Impact

The democratization of code generation is altering the economic landscape of software development. As AI tools become more prevalent, the value of average coding skills may diminish, potentially affecting salaries for entry-level positions. Conversely, developers who excel in system design, architecture, and optimization are likely to see increased demand and compensation.​
Seizing the Opportunity

Vibe coding is most beneficial in areas such as rapid prototyping and building simple applications or internal tools. It frees up valuable time that we can then invest in higher-level tasks such as system architecture, security, and user experience. When used in the right context, AI becomes a helpful partner that accelerates the development process without replacing the need for skilled engineers.

This is revolutionizing our craft, much like the shift from machine language to assembly to high-level languages did in the past. AI can churn out code at lightning speed, but remember, “Any fool can write code that a computer can understand. Good programmers write code that humans can understand.” Use AI for rapid prototyping, but it’s your expertise that transforms raw output into robust, scalable software. By honing our skills in design and architecture, we ensure our work remains impactful and enduring. Let’s continue to learn, adapt, and build software that stands the test of time.​

Ready to streamline your recruitment process? Get a free demo to explore cutting-edge solutions and resources for your hiring needs.

Guide to Conducting Successful System Design Interviews in 2025

What is Systems Design?Systems Design is an all encompassing term which encapsulates both frontend and backend components harmonized to define the overall architecture of a product.Designing robust and scalable systems requires a deep understanding of application, architecture and their underlying components like networks, data, interfaces and modules.Systems Design, in its...

What is Systems Design?

Systems Design is an all encompassing term which encapsulates both frontend and backend components harmonized to define the overall architecture of a product.

Designing robust and scalable systems requires a deep understanding of application, architecture and their underlying components like networks, data, interfaces and modules.

Systems Design, in its essence, is a blueprint of how software and applications should work to meet specific goals. The multi-dimensional nature of this discipline makes it open-ended – as there is no single one-size-fits-all solution to a system design problem.

What is a System Design Interview?

Conducting a System Design interview requires recruiters to take an unconventional approach and look beyond right or wrong answers. Recruiters should aim for evaluating a candidate’s ‘systemic thinking’ skills across three key aspects:

How they navigate technical complexity and navigate uncertainty
How they meet expectations of scale, security and speed
How they focus on the bigger picture without losing sight of details

This assessment of the end-to-end thought process and a holistic approach to problem-solving is what the interview should focus on.

What are some common topics for a System Design Interview

System design interview questions are free-form and exploratory in nature where there is no right or best answer to a specific problem statement. Here are some common questions:

How would you approach the design of a social media app or video app?

What are some ways to design a search engine or a ticketing system?

How would you design an API for a payment gateway?

What are some trade-offs and constraints you will consider while designing systems?

What is your rationale for taking a particular approach to problem solving?

Usually, interviewers base the questions depending on the organization, its goals, key competitors and a candidate’s experience level.

For senior roles, the questions tend to focus on assessing the computational thinking, decision making and reasoning ability of a candidate. For entry level job interviews, the questions are designed to test the hard skills required for building a system architecture.

The Difference between a System Design Interview and a Coding Interview

If a coding interview is like a map that takes you from point A to Z – a systems design interview is like a compass which gives you a sense of the right direction.

Here are three key difference between the two:

Coding challenges follow a linear interviewing experience i.e. candidates are given a problem and interaction with recruiters is limited. System design interviews are more lateral and conversational, requiring active participation from interviewers.

Coding interviews or challenges focus on evaluating the technical acumen of a candidate whereas systems design interviews are oriented to assess problem solving and interpersonal skills.

Coding interviews are based on a right/wrong approach with ideal answers to problem statements while a systems design interview focuses on assessing the thought process and the ability to reason from first principles.

How to Conduct an Effective System Design Interview

One common mistake recruiters make is that they approach a system design interview with the expectations and preparation of a typical coding interview.
Here is a four step framework technical recruiters can follow to ensure a seamless and productive interview experience:

Step 1: Understand the subject at hand

  • Develop an understanding of basics of system design and architecture
  • Familiarize yourself with commonly asked systems design interview questions
  • Read about system design case studies for popular applications
  • Structure the questions and problems by increasing magnitude of difficulty

Step 2: Prepare for the interview

  • Plan the extent of the topics and scope of discussion in advance
  • Clearly define the evaluation criteria and communicate expectations
  • Quantify constraints, inputs, boundaries and assumptions
  • Establish the broader context and a detailed scope of the exercise

Step 3: Stay actively involved

  • Ask follow-up questions to challenge a solution
  • Probe candidates to gauge real-time logical reasoning skills
  • Make it a conversation and take notes of important pointers and outcomes
  • Guide candidates with hints and suggestions to steer them in the right direction

Step 4: Be a collaborator

  • Encourage candidates to explore and consider alternative solutions
  • Work with the candidate to drill the problem into smaller tasks
  • Provide context and supporting details to help candidates stay on track
  • Ask follow-up questions to learn about the candidate’s experience

Technical recruiters and hiring managers should aim for providing an environment of positive reinforcement, actionable feedback and encouragement to candidates.

Evaluation Rubric for Candidates

Facilitate Successful System Design Interview Experiences with FaceCode

FaceCode, HackerEarth’s intuitive and secure platform, empowers recruiters to conduct system design interviews in a live coding environment with HD video chat.

FaceCode comes with an interactive diagram board which makes it easier for interviewers to assess the design thinking skills and conduct communication assessments using a built-in library of diagram based questions.

With FaceCode, you can combine your feedback points with AI-powered insights to generate accurate, data-driven assessment reports in a breeze. Plus, you can access interview recordings and transcripts anytime to recall and trace back the interview experience.

Learn how FaceCode can help you conduct system design interviews and boost your hiring efficiency.

How Candidates Use Technology to Cheat in Online Technical Assessments

Impact of Online Assessments in Technical Hiring In a digitally-native hiring landscape, online assessments have proven to be both a boon and a bane for recruiters and employers. The ease and...

Impact of Online Assessments in Technical Hiring


In a digitally-native hiring landscape, online assessments have proven to be both a boon and a bane for recruiters and employers.

The ease and efficiency of virtual interviews, take home programming tests and remote coding challenges is transformative. Around 82% of companies use pre-employment assessments as reliable indicators of a candidate's skills and potential.

Online skill assessment tests have been proven to streamline technical hiring and enable recruiters to significantly reduce the time and cost to identify and hire top talent.

In the realm of online assessments, remote assessments have transformed the hiring landscape, boosting the speed and efficiency of screening and evaluating talent. On the flip side, candidates have learned how to use creative methods and AI tools to cheat in tests.

As it turns out, technology that makes hiring easier for recruiters and managers - is also their Achilles' heel.

Cheating in Online Assessments is a High Stakes Problem


With the proliferation of AI in recruitment, the conversation around cheating has come to the forefront, putting recruiters and hiring managers in a bit of a flux.


According to research, nearly 30 to 50 percent of candidates cheat in online assessments for entry level jobs. Even 10% of senior candidates have been reportedly caught cheating.

The problem becomes twofold - if finding the right talent can be a competitive advantage, the consequences of hiring the wrong one can be equally damaging and counter-productive.

As per Forbes, a wrong hire can cost a company around 30% of an employee's salary - not to mention, loss of precious productive hours and morale disruption.

The question that arises is - "Can organizations continue to leverage AI-driven tools for online assessments without compromising on the integrity of their hiring process? "

This article will discuss the common methods candidates use to outsmart online assessments. We will also dive deep into actionable steps that you can take to prevent cheating while delivering a positive candidate experience.

Common Cheating Tactics and How You Can Combat Them


  1. Using ChatGPT and other AI tools to write code

    Copy-pasting code using AI-based platforms and online code generators is one of common cheat codes in candidates' books. For tackling technical assessments, candidates conveniently use readily available tools like ChatGPT and GitHub. Using these tools, candidates can easily generate solutions to solve common programming challenges such as:
    • Debugging code
    • Optimizing existing code
    • Writing problem-specific code from scratch
    Ways to prevent it
    • Enable full-screen mode
    • Disable copy-and-paste functionality
    • Restrict tab switching outside of code editors
    • Use AI to detect code that has been copied and pasted
  2. Enlist external help to complete the assessment


    Candidates often seek out someone else to take the assessment on their behalf. In many cases, they also use screen sharing and remote collaboration tools for real-time assistance.

    In extreme cases, some candidates might have an off-camera individual present in the same environment for help.

    Ways to prevent it
    • Verify a candidate using video authentication
    • Restrict test access from specific IP addresses
    • Use online proctoring by taking snapshots of the candidate periodically
    • Use a 360 degree environment scan to ensure no unauthorized individual is present
  3. Using multiple devices at the same time


    Candidates attempting to cheat often rely on secondary devices such as a computer, tablet, notebook or a mobile phone hidden from the line of sight of their webcam.

    By using multiple devices, candidates can look up information, search for solutions or simply augment their answers.

    Ways to prevent it
    • Track mouse exit count to detect irregularities
    • Detect when a new device or peripheral is connected
    • Use network monitoring and scanning to detect any smart devices in proximity
    • Conduct a virtual whiteboard interview to monitor movements and gestures
  4. Using remote desktop software and virtual machines


    Tech-savvy candidates go to great lengths to cheat. Using virtual machines, candidates can search for answers using a secondary OS while their primary OS is being monitored.

    Remote desktop software is another cheating technique which lets candidates give access to a third-person, allowing them to control their device.

    With remote desktops, candidates can screen share the test window and use external help.

    Ways to prevent it
    • Restrict access to virtual machines
    • AI-based proctoring for identifying malicious keystrokes
    • Use smart browsers to block candidates from using VMs

Future-proof Your Online Assessments With HackerEarth

HackerEarth's AI-powered online proctoring solution is a tested and proven way to outsmart cheating and take preventive measures at the right stage. With HackerEarth's Smart Browser, recruiters can mitigate the threat of cheating and ensure their online assessments are accurate and trustworthy.
  • Secure, sealed-off testing environment
  • AI-enabled live test monitoring
  • Enterprise-grade, industry leading compliance
  • Built-in features to track, detect and flag cheating attempts
Boost your hiring efficiency and conduct reliable online assessments confidently with HackerEarth's revolutionary Smart Browser.
Top Products

Explore HackerEarth’s top products for Hiring & Innovation

Discover powerful tools designed to streamline hiring, assess talent efficiently, and run seamless hackathons. Explore HackerEarth’s top products that help businesses innovate and grow.
Frame
Hackathons
Engage global developers through innovation
Arrow
Frame 2
Assessments
AI-driven advanced coding assessments
Arrow
Frame 3
FaceCode
Real-time code editor for effective coding interviews
Arrow
Frame 4
L & D
Tailored learning paths for continuous assessments
Arrow
Get A Free Demo